| A Mathematics teacher was curious to establish if her learners' Mathematics marks influenced their Physical Sciences marks. In the table below, the Mathematics and Physical Sciences marks of 15 learners in her class are given as percentages (%). |
| MATHEMATICS (AS %) | 26 | 62 | 21 | 33 | 53 | 76 | 32 | 59 | | 43 | 33 | 49 | 51 | 19 | 34 | 85 | | | PHYSICAL SCIENCES (AS %) | 34 | 67 | 28 | 46 | 65 | 76 | 26 | 73 | | 50 | 39 | 57 | 51 | 24 | 41 | 80 | |
|
| 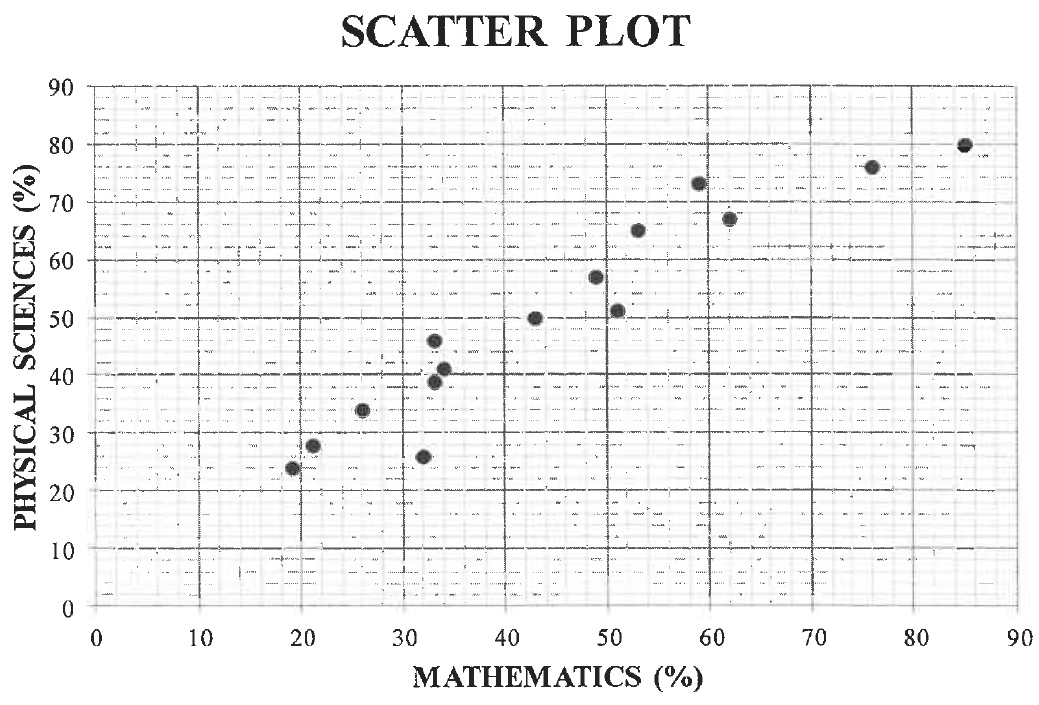 | |
| 1.1 | Determine the equation of the least squares regression line for the data. | (3) |
| 1.2 | Draw the least squares regression line on the scatter plot provided in the ANSWER BOOK. | (2) |
| 1.3 | Predict the Physical Sciences mark of a learner who achieved 69% for Mathematics. | (2) |
| 1.4 | Write down the correlation coefficient between the Mathematics and Physical Sciences marks for the data. | (1) |
| 1.5 | Comment on the strength of the correlation between the Mathematics and Physical Sciences marks for the data. | (1) |
| 1.6 | What trend did the teacher observe between the results of the two subjects? | (1) |
| | [10] |