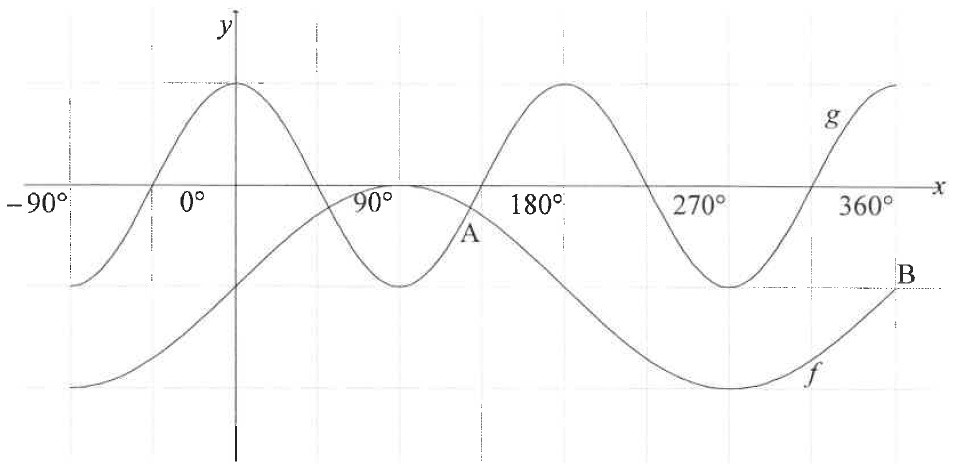
| In the diagram, the graphs of f(x)=sinx−1 and g(x)=cos2x are drawn for the interval x∈[−90∘;360∘]. Graphs f and g intersect at A. B(360∘;−1) is a point on f. |
|  | |
| 6.1 | Write down the range of f. | (2) |
| 6.2 | Write down the values of x in the interval x∈[−90∘;360∘] for which graph f is decreasing. | (2) |
| 6.3 | P and Q are points on the graphs g and f respectively such that PQ is parallel to the y-axis. If PQ lies between A and B, determine the value(s) of x for which PQ will be a maximum. | (6) |
| | [10] |